In today’s data-driven world, businesses are generating massive amounts of data every second. However, raw data on its own has little value unless it is transformed into meaningful insights. This is where data visualization comes into play. It is the art and science of representing data in a graphical format, making complex information easier to understand and act upon. From simple bar charts to intricate heat maps, data visualization enables organizations to identify patterns, trends, and outliers, allowing for better decision-making. In this article, we will explore the importance of data visualization, its modern tools, and how InfiBis, a next-generation business intelligence suite, is revolutionizing data storytelling with AI and blockchain technology.
Table of contents
Why is Data Visualization Important?
1. Enhancing Comprehension
Human brains process visual information 60,000 times faster than text. A well-designed chart or graph can convey a message in seconds, whereas raw numbers may take minutes or hours to interpret. Visual storytelling helps businesses quickly grasp critical insights.
2. Identifying Trends and Patterns
By visualizing data, companies can recognize patterns that might otherwise go unnoticed. Line charts can reveal market trends, while scatter plots help identify correlations between variables—both crucial for making strategic decisions.
3. Improving Decision-Making
Data visualization supports real-time analysis, enabling businesses to act quickly based on insights. For example, retailers can monitor sales trends and adjust their inventory in response to changing consumer demand.
4. Increased Engagement and Communication
Whether in business presentations, reports, or dashboards, data visualization makes complex topics more engaging. Interactive dashboards allow users to explore data dynamically, leading to more informed discussions and strategies.
Modern Tools for Data Visualization
With advancements in technology, businesses no longer need to rely on static spreadsheets for data analysis. Several powerful tools help create compelling visual narratives. Some of the leading data visualization tools include:
1. Tableau
One of the most popular business intelligence tools, Tableau allows users to create interactive and shareable dashboards. Its drag-and-drop functionality makes it easy to analyze complex datasets without advanced programming skills.
2. Power BI
Developed by Microsoft, Power BI offers robust integration with other Microsoft applications. It provides real-time dashboards and predictive analytics, making it a go-to choice for enterprises.
3. Google Data Studio
This free tool from Google enables users to create customizable reports that integrate seamlessly with Google Analytics, Google Ads, and other data sources.
4. D3.js
For developers looking for complete customization, D3.js is a JavaScript library that enables the creation of highly interactive and dynamic visualizations.
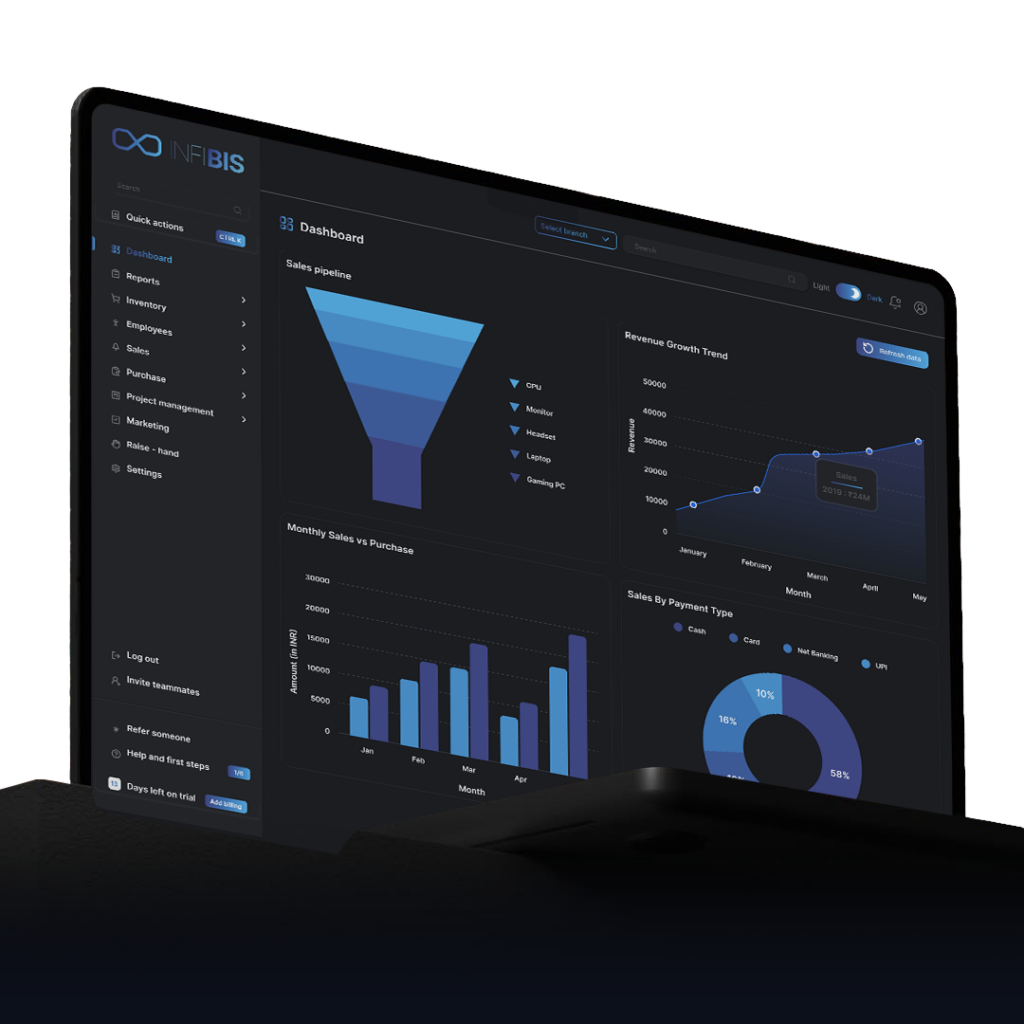
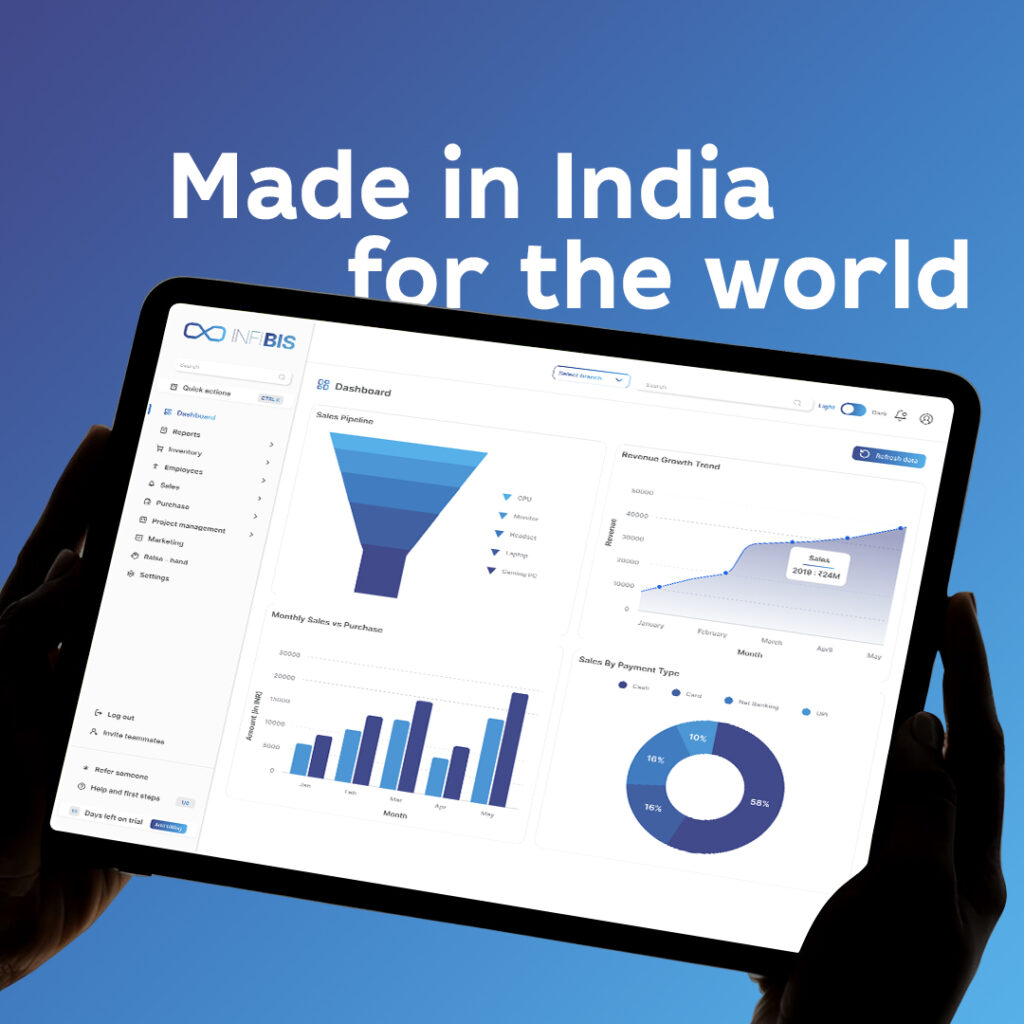
5. InfiBis: AI-Powered Data Visualization
While traditional tools offer visualization capabilities, InfiBis takes it a step further by integrating artificial intelligence and blockchain technology. With real-time predictive analytics, automated reporting, and blockchain-backed security, InfiBis ensures data integrity and transparency.
InfiBis: Transforming Data Visualization with AI & Blockchain
AI-Powered Insights
Unlike conventional BI tools, InfiBis leverages AI to analyze vast datasets and provide actionable insights instantly. Instead of static charts, businesses get dynamic, predictive dashboards that highlight potential risks and opportunities.
Blockchain-Backed Data Security
Data integrity is a significant concern for businesses dealing with sensitive information. InfiBis integrates blockchain technology, ensuring all business transactions and data points are securely recorded and tamper-proof. This makes decision-making transparent and fraud-resistant.
Cross-Border Payment Insights with InfiVault
Global businesses require real-time financial insights. With InfiVault, companies can visualize their cross-border payments and track transactions with unparalleled security. This is particularly useful for e-commerce, logistics, and multinational enterprises.
Connaisseur 101: A Blockchain for the Future
At the foundation of InfiBis is Connaisseur 101, a Layer-1 blockchain designed to revolutionize financial transactions. With the increasing demand for cross-border payments and secure financial interactions, Connaisseur 101 ensures that businesses operate with maximum efficiency and minimal friction.
How to Leverage InfiBis for Your Business?
1. Automate Your Data Analysis
Say goodbye to manual spreadsheets. With InfiBis, your data is processed in real-time, offering AI-driven reports and visualizations that are always up to date.
2. Secure Your Business Data
Blockchain technology ensures that your business insights remain untampered. Whether handling financial records, customer insights, or sales reports, InfiBis provides an unparalleled level of security.
3. Make Smarter Financial Decisions
With InfiVault’s financial visualization tools, businesses can track payments, expenses, and revenue trends in a highly visual format, making budgeting and forecasting more effective.
4. Stay Ahead of Market Trends
With AI-driven predictive analytics, InfiBis helps you stay ahead by identifying emerging trends in your industry, giving you a competitive edge.
Conclusion: The Future of Data Visualization is Here
In an era where data is more valuable than ever, businesses that fail to leverage modern visualization tools risk falling behind. Beyond spreadsheets, modern tools like AI and blockchain-powered business intelligence suites are reshaping how companies analyze and act upon data.
With InfiBis, businesses gain access to a comprehensive, secure, and intelligent platform designed for the modern economy. Whether you are a startup, a multinational corporation, or an investor, InfiBis equips you with the right tools to visualize, analyze, and act upon data in real-time.
🚀 Experience the future of data-driven decision-making with InfiBis. Learn more at buy.infibis.com